Cheddar

If you are a food-web ecologist working in R, Cheddar will save you time
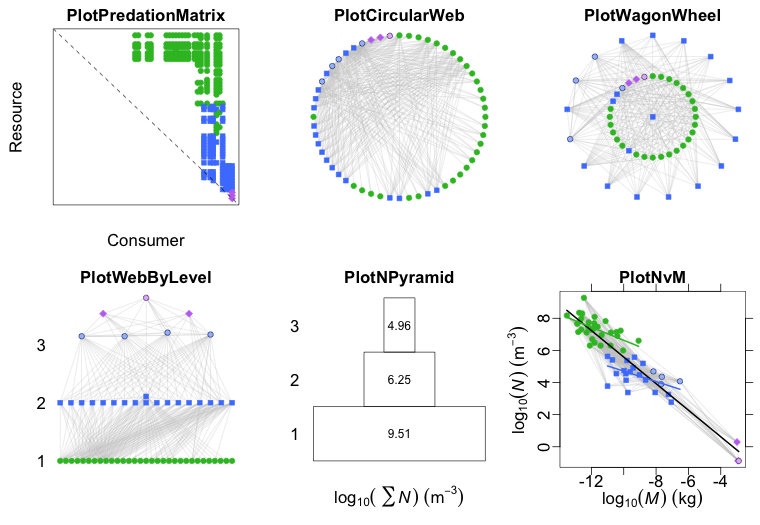
So what does it do?

Some example plots and tables are below, together with the R code that generated them.

Mass-abundance allometry

library(cheddar)
data(TL84)
PlotNvM(TL84)
Example mass-abundance allometry plot

Predation matrix

library(cheddar)
data(TL84)
PlotPredationMatrix(TL84)
Example predation matrix plot

Nodes stacked vertically by trophic level

library(cheddar)
data(TL84)
PlotWebByLevel(TL84)
Example web by leve plot

Consumer vs resource body mass

library(cheddar)
data(TL84)
PlotMCvMR(TL84)
Example consumer vs resource body mass plot

Prey-averaged trophic level vs body mass

library(cheddar)
data(TL84)
PlotNPS(TL84, 'Log10M', 'PreyAveragedTrophicLevel')
Example trophic level vs body mass plot

A table of node properties

library(cheddar)
data(TL84)
tail(NPS(TL84, c('Log10M', 'Log10N', TL='PreyAveragedTrophicLevel', 
                 TS='TrophicSpecies')))
                          Log10M     Log10N       TL TS
Trichocerca cylindrica -9.420216  4.9116902 2.000000 16
Tropocyclops prasinus  -8.164309  4.6919651 3.142857 13
Chaoborus punctipennis -6.522879  4.0791812 3.171344 20
Phoxinus eos           -2.995679  0.2944662 3.529951 21
Phoxinus neogaeus      -2.931814 -0.8761484 3.529951 21
Umbra limi             -2.889410 -0.8794261 3.802678 22

These examples scratch the surface of what Cheddar can do! Why not install it and try it for yourself?